Dashboard
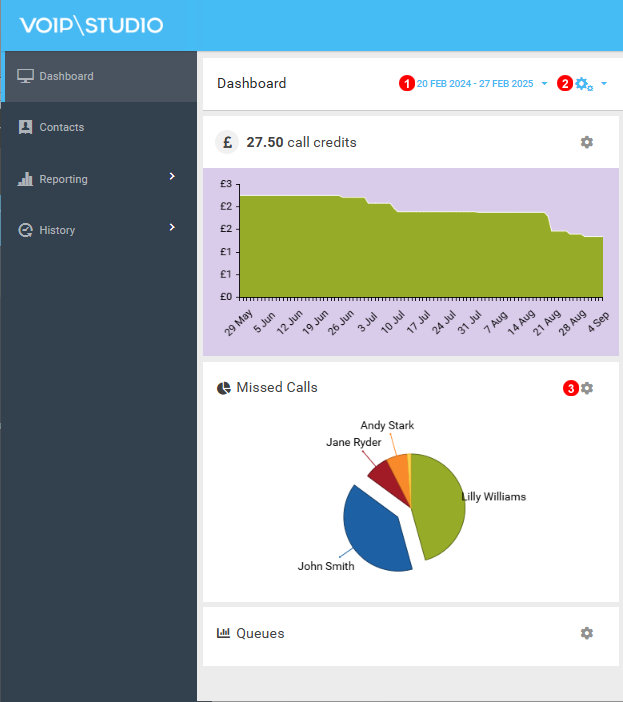
Figure 2.1 Supervisor Dashboard Queue Statistics.
The Dashboard provides a summary of all activity on your account.
- Select Time Interval to display on Graphs.
- To add additional or previously removed Graphs just click and select desired options.
- All Graphs can be removed and later added to Dashboard except for Call Credit Panel.
Dashboard Queue Statistics
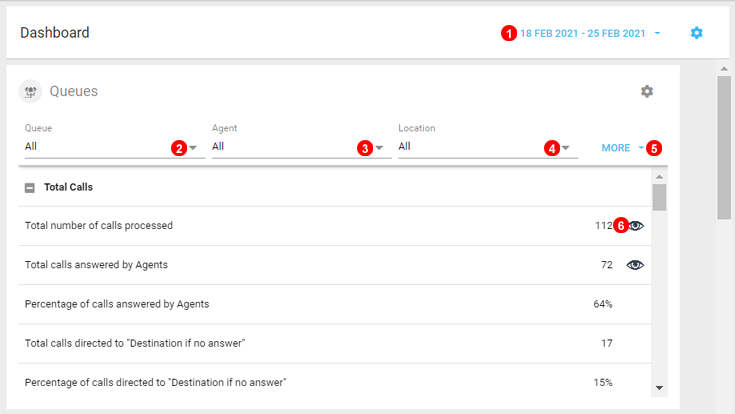
Figure 2.2 Dashboard Queue Statistics.
- Select Dates to filter.
- Select Single or Multiple Queue`s to filter.
- Select Single or Miltiple Agents to filter.
- Select Different Locations to filter.
- Click to export selected data to CSV.
- Click on the Eye Icon to display additional Details.
Note: ACD or Average Call Duration refers to routing strategy "Longest Idle Agent First"
Pie Charts
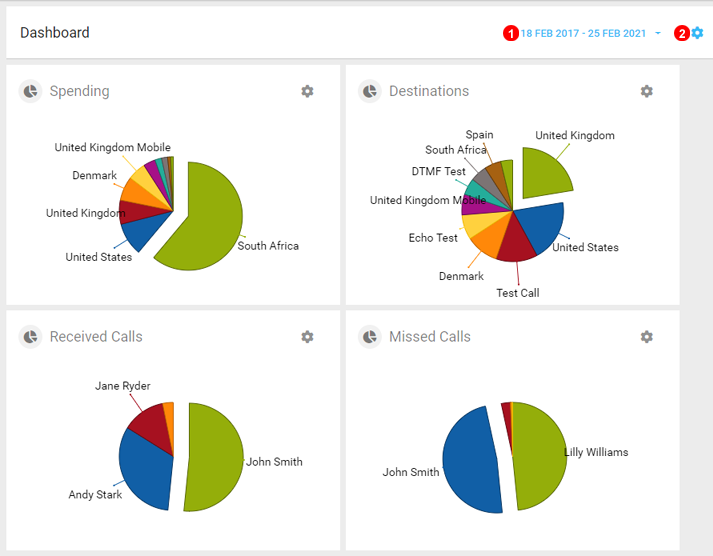
Figure 2.3 Dashboard Pie Charts.
- The Data displayed on the Charts are depending on the data set at the top of the dashboard.
- Click the Gear Icon to Change which charts are displayed on the Dashboard.
Call Volume
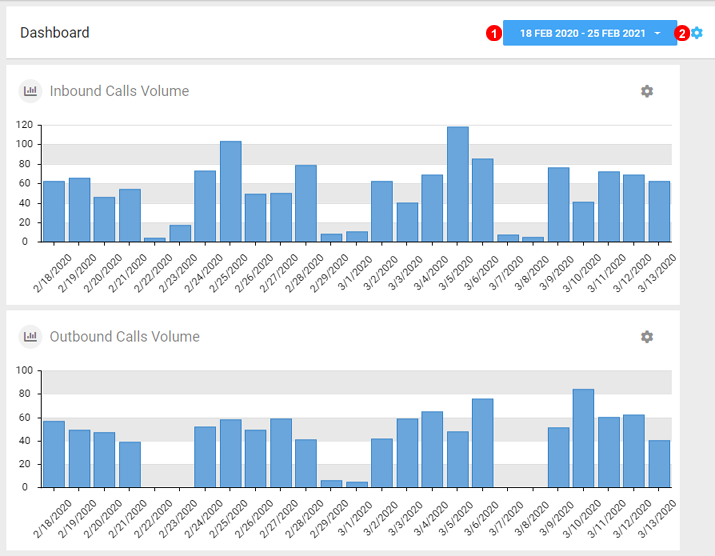
Figure 2.4 Dashboard Call Volumes.
- The Data displayed on the Charts are depending on the data set at the top of the dashboard.
- Click the Gear Icon to Change which charts are displayed on the Dashboard.
Note: Please note Inbound call volume show inbound attended calls and missed calls.