Key principles and definitions (read first)
1. System metrics are canonical
System metrics are the authoritative, platform-level definitions and cannot be renamed globally. Users can duplicate a tile and rename it for context, but the canonical metric and its tile cannot be renamed. This approach ensures consistency and guarantees that teams across the organisation are always measuring performance using the same trusted baseline.
2. Metrics vs Tiles
A Metric is the calculation and definition (formula, aggregation, units). A Tile is a visual representation of metrics on dashboards. Multiple (duplicated) tiles can reference the same metric without creating new metric definitions.
3. Default dashboards and categories
Analytics Dashboard includes predefined operational categories: Contact Center Operations, Team Performance, Customer Experience, and Expense Management. These categories group canonical system metrics. Default dashboards are aligned to these categories to ensure consistent structure, reporting, and performance measurement across the platform.
4. Default vs custom dashboards
Default dashboards are system-provided and aligned with operational categories. Custom dashboards allow users to organise tiles for specific needs. You can mix tiles from different predefined operational categories on custom dashboards. Creating a custom dashboard does not create new canonical metrics.
5. Dashboards present, not define, metrics
Dashboards group and display tiles for specific use cases. They do not own or modify metric definitions.
6. Home dashboard is a presentation layer
Home is a curated overview of key contact center operations. It aggregates tiles (metrics) from multiple operational categories.
7. KPI Targets
KPI Targets are attached to metric definitions at the category level. Once configured, they are automatically compared against live or aggregated data and displayed next to the corresponding metrics across dashboards when Show KPI Targets is enabled. Dashboards visualise KPI comparisons but do not manage or override KPI targets.
8. CX Score metrics
CX Score-related metrics are AI-powered diagnostic assessments. They are not eligible for KPI targets setting (see KPI Targets). Use them for insight and investigation, not target-setting.
9. CX Add-on licensing and feature access
Some platform features require a CX Add-on licence to become available. There are two levels of access:
- Account-level access: At least one CX Add-on licence on the account unlocks KPI target settings and live metrics with their associated KPI targets for the entire account. Individual per-user CX Add-on assignment is not required for these features.
- Per-user access: CX Score metrics and AI-powered conversation insights on call recordings require a CX Add-on licence assigned to the individual user. These features are available only to users with their own CX Add-on licence.
| Feature | Licence required |
|---|---|
| KPI target settings | At least one CX Add-on on the account |
| Live metrics | At least one CX Add-on on the account |
| CX Score metrics | CX Add-on per individual user |
| AI-powered insights on call recordings | CX Add-on per individual user |
10. Timezones and data display
Timezone handling in the Analytics Dashboard varies depending on where and how data is displayed:
- Browser timezone: live and historical data on dashboards
All live and historical data is displayed according to your browser's local timezone. This ensures that timestamps, date ranges, and chart breakdowns reflect your local hours as detected from your device. - Global account timezone: canonical data reference
The account timezone is configured by an Administrator in the account billing profile (see Billing Profile). This timezone defines how data is stored and aggregated at the platform level. It serves as the authoritative timezone for reporting and is the reference used when generating scheduled reports. - Scheduled analytics timezone: report generation and delivery
When scheduling a report, you select a timezone that controls when the report is generated and delivered, for example, ensuring a daily report is sent at 08:00 in your selected timezone. However, the data included in the report is always calculated and presented according to the global account timezone, not the scheduled report timezone or your browser timezone. This means the data coverage (e.g. what counts as "yesterday" or "last week") reflects the account timezone, regardless of when or where the report is received.
| Context | Timezone used |
|---|---|
| Live and historical data on dashboards | Browser (client) timezone |
| Data storage and aggregation | Global account timezone |
| Scheduled report generation and delivery | Timezone selected in report settings |
| Data content inside scheduled reports | Global account timezone |
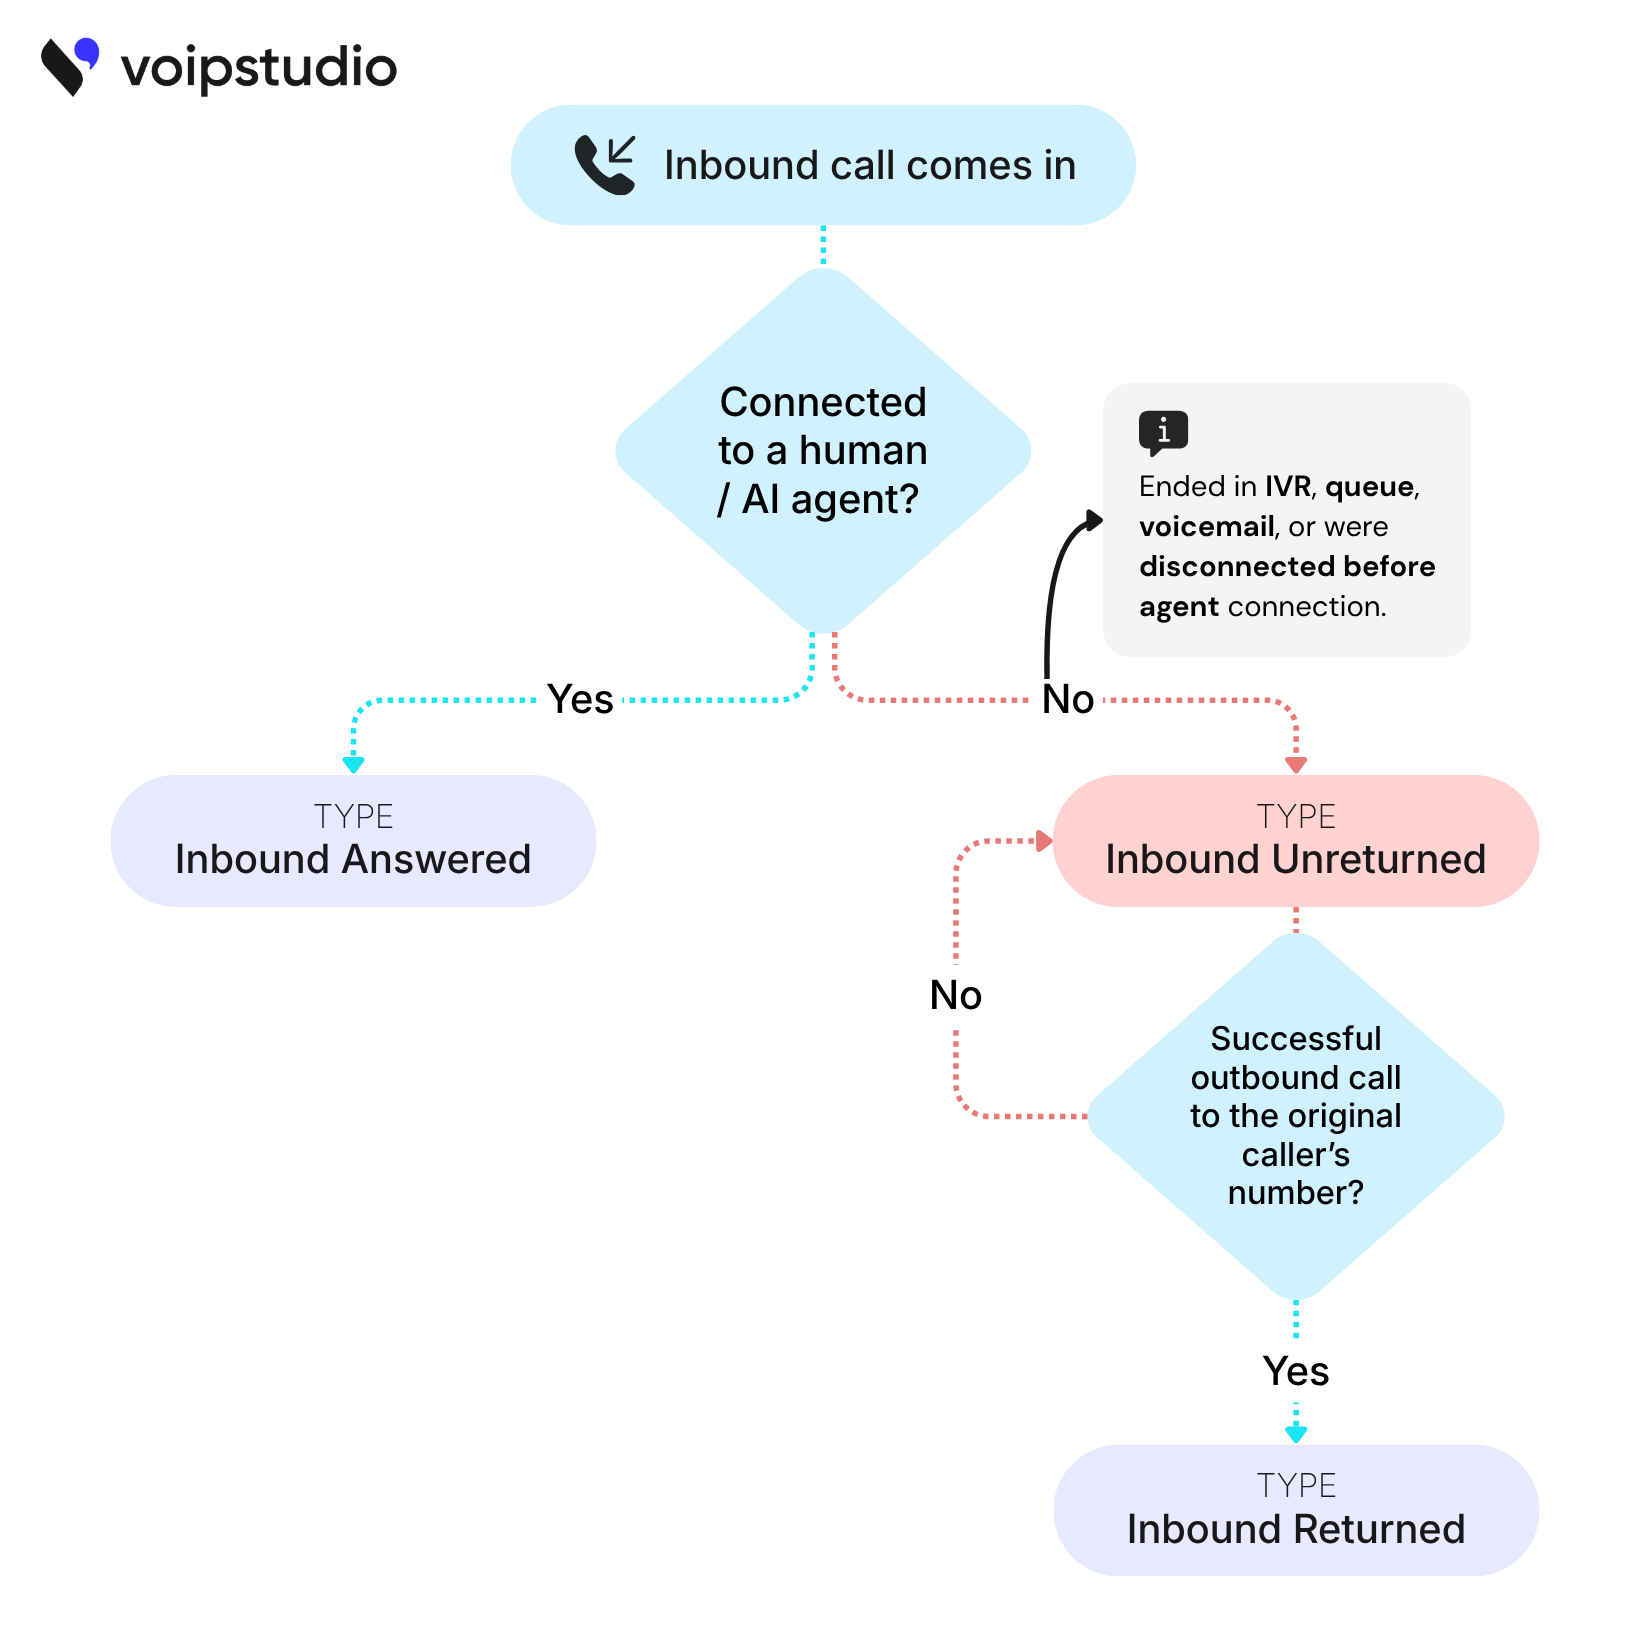
11. Inbound call flow
Inbound call types (Answered, Returned, Unreturned) are determined by how each call progresses through the call flow, as illustrated in the infographic below.
12. Scope of analytics data
Internal calls are excluded from analytics dashboards.
All analytics dashboards reflect external conversations only. Calls made between users within the same VoIPstudio account (for example, agent-to-agent or internal extension calls) are not included in dashboard data or aggregated metrics.
This ensures that analytics accurately represent customer-facing activity and are not skewed by internal communication volume.
Info
Internal calls are still fully logged and accessible in Call History. All records remain
available there for review, compliance, or audit purposes.