Table of contents
At VoIPstudio, we strive to incorporate all those functionalities that help our clients to optimise their business communications.
Just as important as having a good communications platform is measuring its usefulness or the performance of your agents. A handy feature to cover this need is the call reports within the system. That is why in VoIPstudio we’ve included a new section in our control panel dedicated exclusively to call reports.
In addition, reports can also help to realise where we should focus our efforts, showing which category of calls brings more benefits or offers a better service.
Where to find the reporting functionality in VoIPstudio
With VoIPstudio’s new functionality, you can generate reports based on predefined metrics that will allow you to develop the most valuable reports. For example, you can track the volume and duration of calls from each of your sales agents. Or check the calls your call center has handled as well as the missed calls. In the same way, the reports will help you to control your call costs.
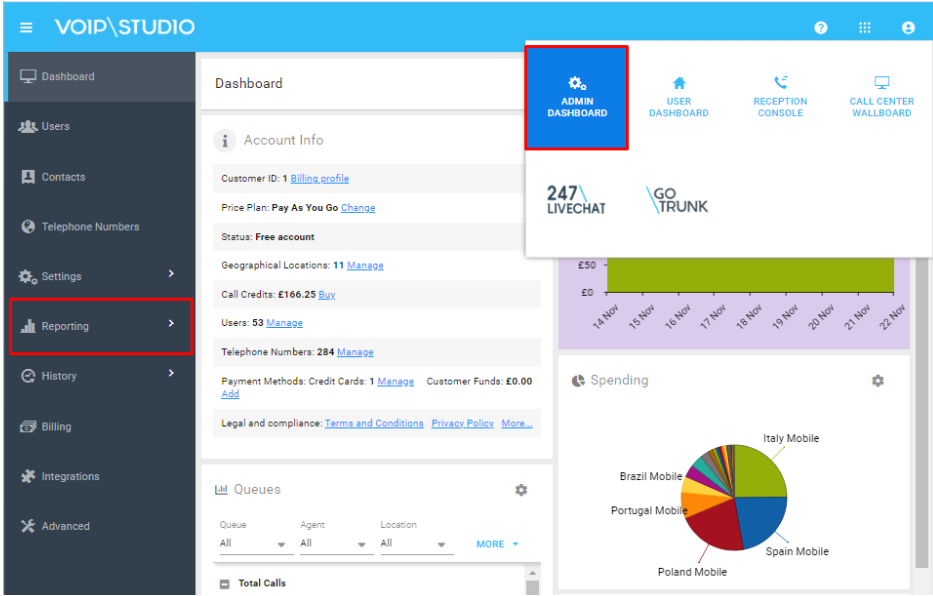
This new reporting section is available in the VoIPstudio admin panel under the side menu:
How do VoIPstudio reports work?
Only users with Administrator permissions can access this new section. Once inside, administrators can share templates and reports already generated. In addition, they can export reports to CSV format.
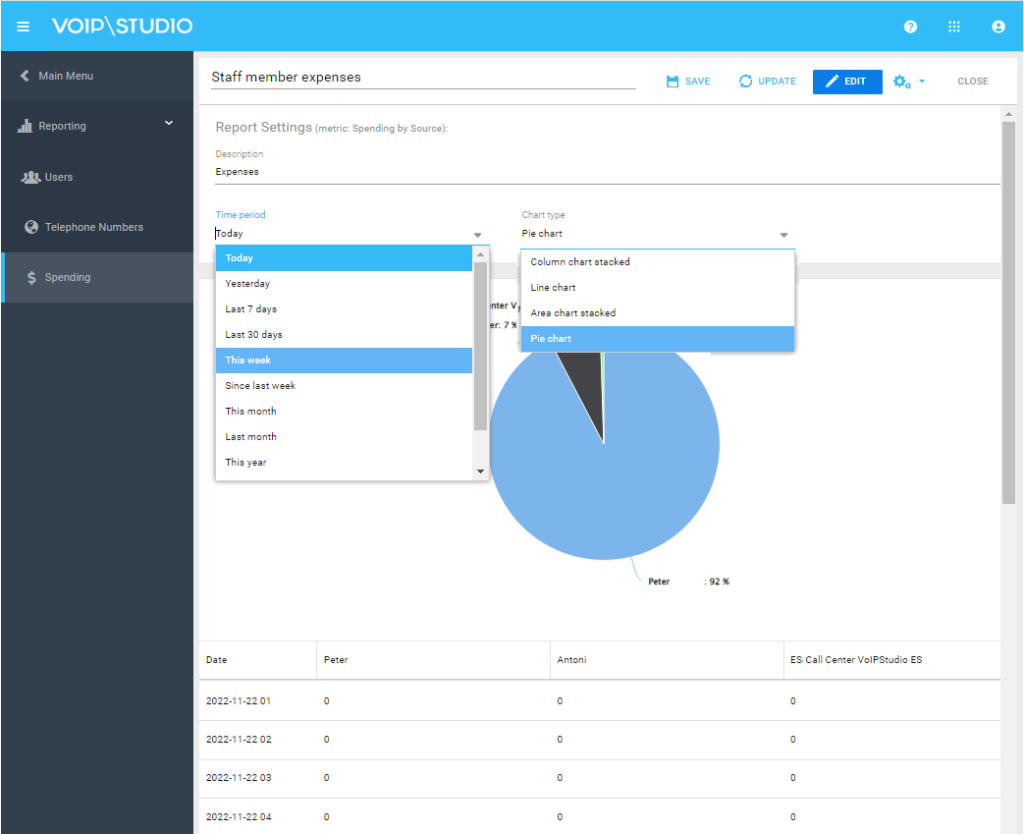
When generating or editing reports, you can filter the data by a customised period or predefined period: today, this week, or last month.
In addition, you can define which type of graph you prefer for your report: column chart stacked, area chart stacked, pie charts, or line charts.
In the following video we show how to get a report of the customer service number performance for technical support and for sales for the last 7 days:
Types of reports offered by the VoIPstudio plataform
We have enabled three report categories: user, phone number, and expenses.
In the following sections, we will analyse what information you can obtain from these categories.
Users Reports
These allow you to analyse the performance of each agent, both for incoming and outgoing calls.
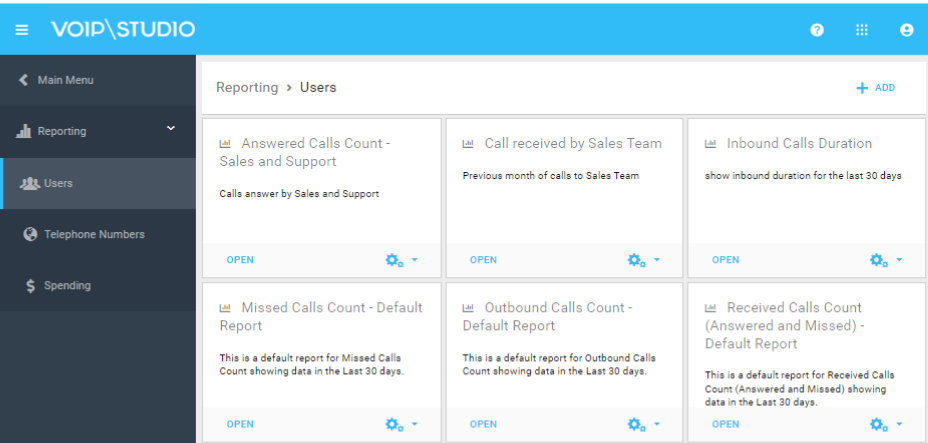
You can generate customised reports with the following metrics:
- Established calls counter
- Established calls duration
- Received calls counter (dialed and unanswered)
- Answered calls counter
- Answered calls duration
- Missed calls counter
When setting up this report, you can define the period and type of graph. In addition, user reports also allow you to filter by user, team, or location. This way, you can get statistics for a single agent, a whole team, or a particular area.
Call reports by the agent also allow you to filter by a label. For example, if your employees differentiate and tag sales and support calls, you could compare which category of calls agents spend the most time on.
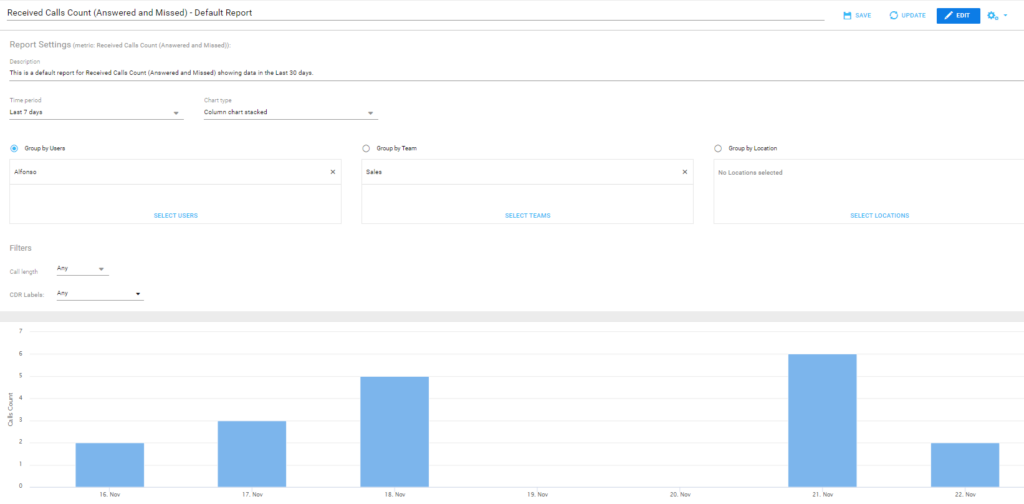
Reports by Phone Number
These allow us to analyse the performance of each telephone number, both for incoming and outgoing calls. Metrics available are:
- Established calls counter
- Established calls duration
- Received calls counter (dialed and unanswered)
- Answered calls counter
- Missed calls counter
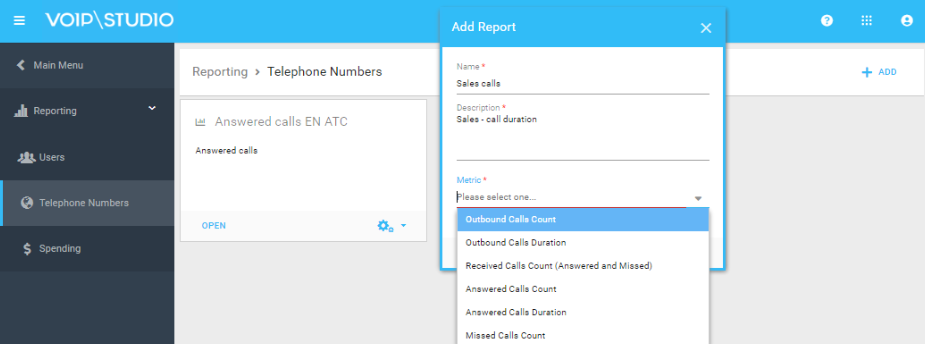
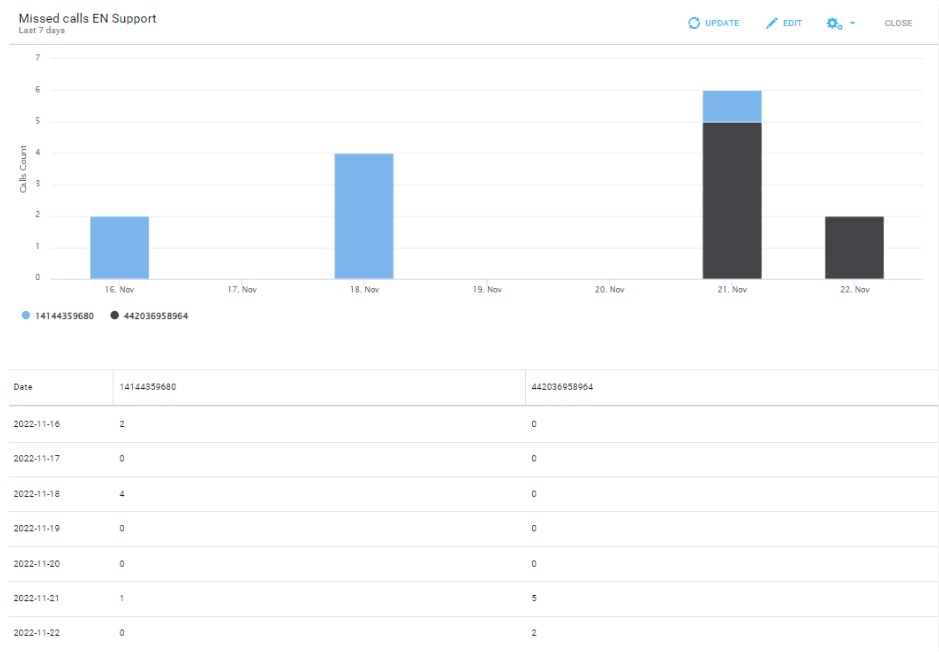
For example, a report of missed calls from our three customer service numbers would look like this:
Expense Report
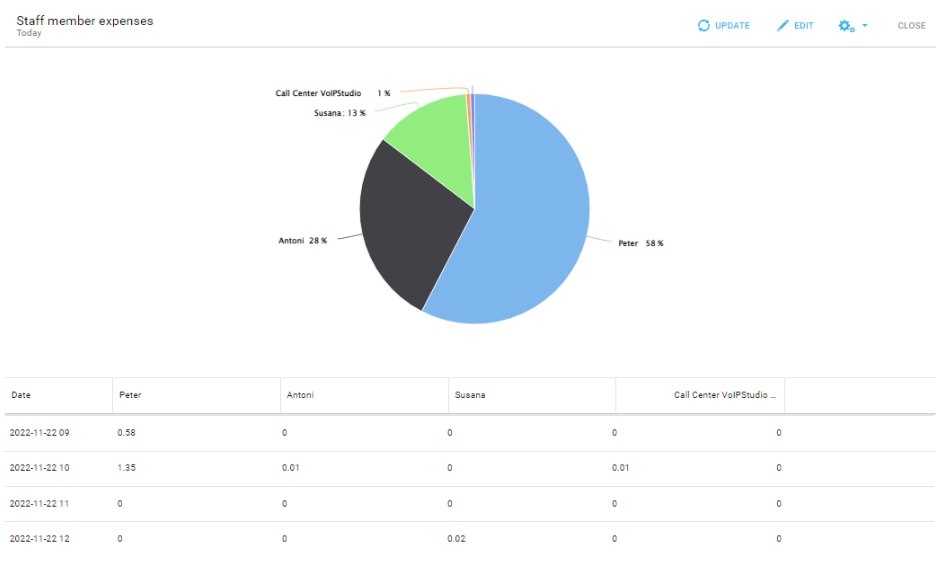
Allow you to analyse balance fluctuations and determine where you spend the most. The metrics available for this category of reports are:
- Balance history
- Expenditure per agent
- Expenditure by call destination
The following example shows the expense report for each of our agents’ calls today.
These are the available reports and functionalities included in this new section. But at VoIPstudio, we are already working on new metrics and improvements. Automation and email forwarding will be available soon. We encourage you to try this new tool and share your opinion to include improvements in this section.
Other reporting tools in VoIPstudio
In addition to this reporting section, VoIPstudio offers you other reporting tools:
Detailed call history or CDR
It shows the list of all calls in the system, with all possible details.
Call balance section
It shows call destinations and the cost of each call.
Call center statistics widget
In the case of using queues, it will allow you to analyse the performance of the queues and the call center agents, as well as the quality of call handling. You can see how to consult the statistics panel of your call center queues in the user manual.
Queue statistics
It allows you to analyse the performance of each queue by looking at whether and how calls have been handled. You will find how to consult the queue statistics dashboard in the user manual.
Other alternatives to VoIPstudio reports
VoIPstudio CDR connector with Google Data Studio
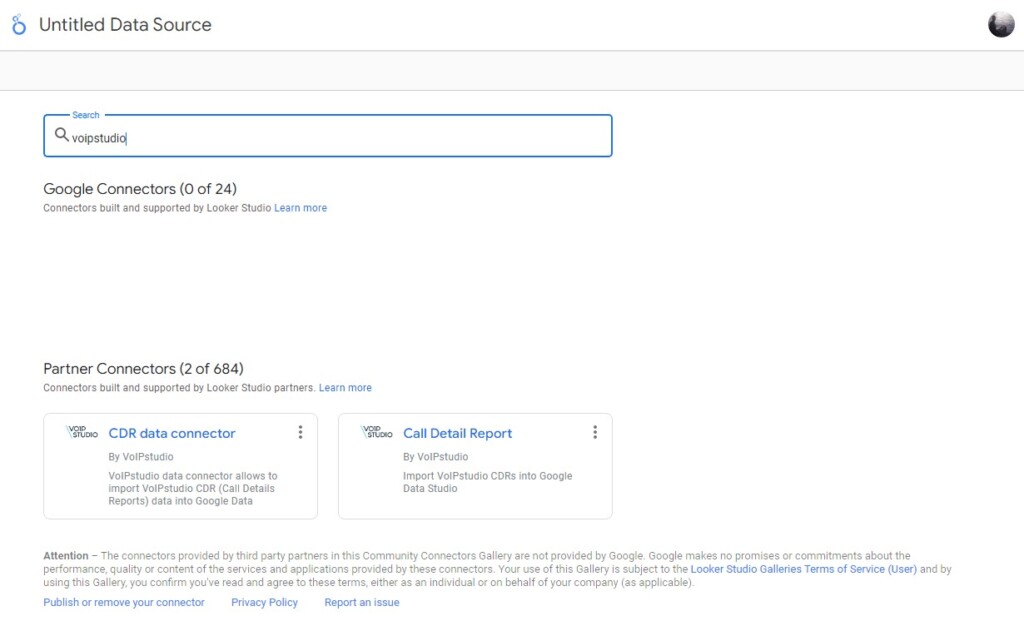
If your business use case is particular, you may not find the exact report that fits your needs. That should not be a problem, as you can easily integrate call history. For example, with Google Data Studio via the “VoIPstudio CDR” connector. It will allow you to import your call data into Google Data Studio and generate customised reports.
If you need help or support to set up your reports in the VoIPstudio dashboard, remember that you can contact our support team and we’ll be happy to help you.
More from the blog
Want to improve your business communication?
Unlock enterprise-class call center power at affordable prices – no hardware, no delays, no surprises!
